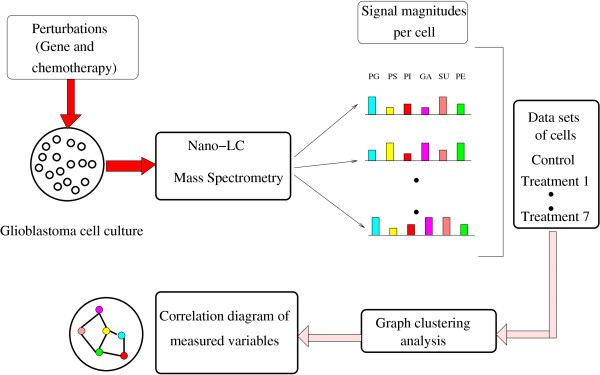
Figure 2.
Lipidomic platform data processing. Graph clustering modeling with U87 MG glioblastoma cell data. The schematic shows a resulting correlation based on nano-LC/MS data. Seven different treatments are applied to a cell line. Graph clustering analysis is performed on this data and a correlation diagram reflecting dependencies in the underlying network is obtained. Abbreviations. PG means phosphatidylglycerol, PS means phosphatidylserine, PI means phosphatidylinositol, PE means phosphatidylethanolamine, GA means gangliosides and SU means sulfatide.

