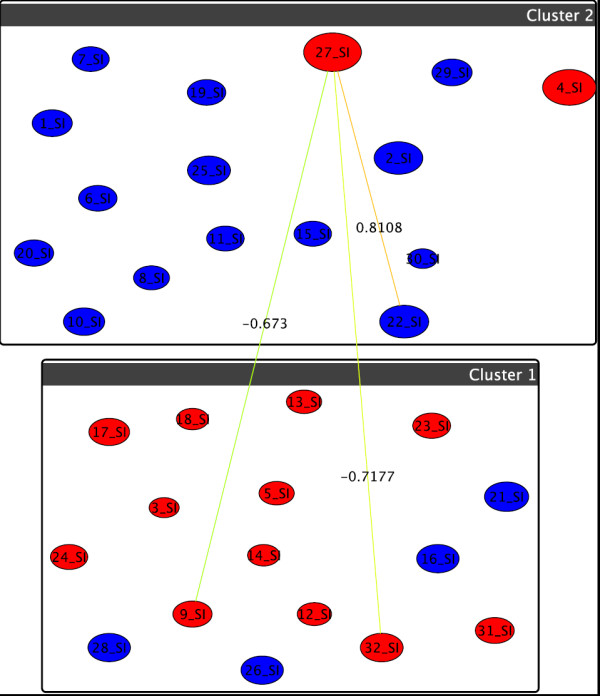
Figure 7.

Graph-clustering correlation network for gangliosides showing the difference between U87+DI312/24hr and U87+p53/24hr. Correlation network resulting from graph-clustering data analysis for a correlation threshold > 0.6 for gangliosides showing no significant changes between the treatments U87+DI312/24hr (T5, boxes) versus U87+p53/24hr (T6, colors). Most notably, the size of v27 = GD1 (d18:1/16:0) and v4 = GM3 (d18:1/16:0)+O show their deviation from the behavior of the other nodes in the upper cluster, for T6, the two move to the red cluster. Most others do not di er heavily in their correlations.
