Figure 3.
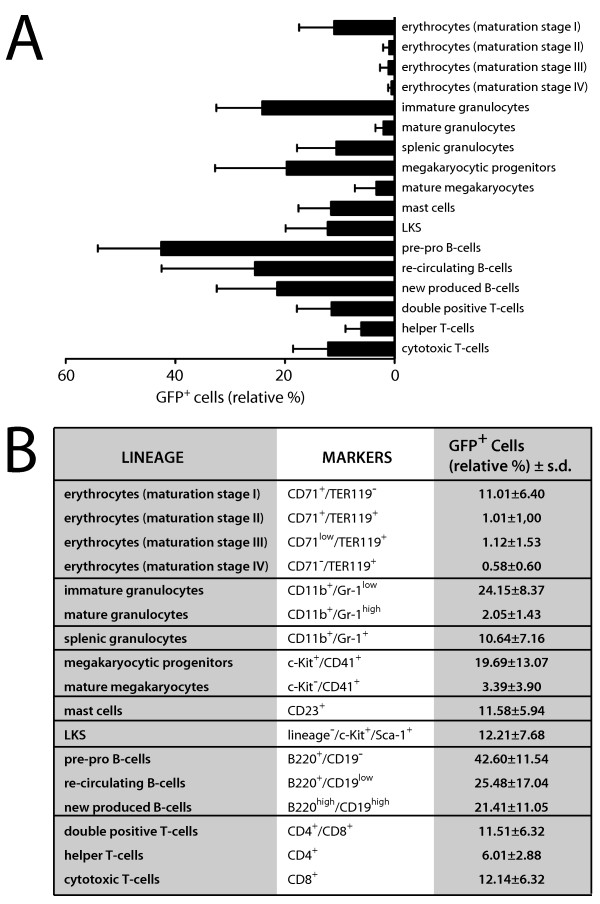
The R26t1Δ mouse line directs transgene expression to adult blood cells and hematopoietic stem and progenitor cells. (A) Expression of GFP in different hematopoietic cells is given as mean values ± standard deviations in a bar graph. Analyzed cell-lineages are shown on the right. For conditional GFP activation three month old mice were exposed to DOX for fourteen days prior to the analysis. No GFP activation was detected in genetically identical littermates not exposed to DOX (not shown). At least four different animals from DOX-induced and non-induced littermate controls were analyzed for hematopoietic lineage determination. (B) In the right column relative percentages of GFP+ cells are indicated as mean values ± standard deviations. Lineage-specific markers are specified in the central white column. Roman numerals refer to different maturation stages of red blood cell development: I, proerythroblasts; II, basophilic erythroblasts; III, late basophilic erythroblasts and chromatophilic erythroblasts; IV, orthochromatophilic erythroblasts. GFP, green fluorescent protein; LKS, lineage-/c-Kit+/Sca1+.

