Figure 4.
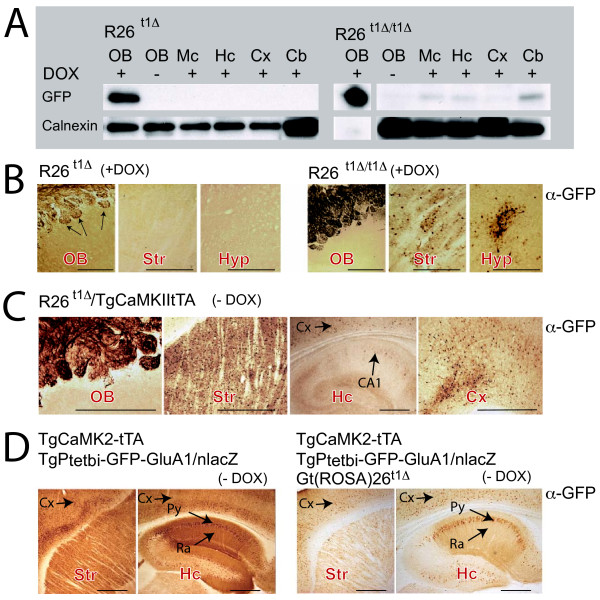
Ptet-GFP expression of the Gt(Rosa)26t1Δ(R26t1Δ) locus is controlled by active iM2 and tTA in the brain of adult mice. (A) Western blots for GFP and calnexin (loading control) of different brain regions in heterozygous (left, R26t1Δ) and homozygous (right, R26t1Δ/t1Δ) mice, raised and kept in the presence of DOX. In R26t1Δ/t1Δ mice the intensity of the GFP signal in the olfactory bulb augmented and was adjusted by shorter exposure time and loading less sample than for other brain tissues. For the R26t1Δ/t1Δ OB lane (+DOX) a shorter exposure time is shown. (B) Immunohistochemical analysis of GFP expression in the OB, Str and Hyp of DOX-treated heterozygous R26t1Δ (left panel) and homozygous R26t1Δ/t1Δ mice (right panel). Induced animals were raised and kept in the presence of DOX. (C) CamKII-induced GFP immunohistochemistry in OB, Str, Cx and Hc of R26t1Δ mice harbouring the additional TgCaMK2-tTA transgene in the absence of DOX (-DOX). (D) GFP immunohistochemistry showing very strong CaMK2-tTA-activated GFP-GluA1 expression in Str and Hc in mice harbouring both the TgCaMK2-tTA and TgPtetbi-GFP-GluA1/nlacZ transgenes (left). Weaker GFP-GluA1 expression was apparent in brains of DOX-untreated mice (right), when in addition to the TgCaMK2-tTA and TgPtetbi-GFPGluA1/nLacZ transgenes the R26t1Δ allele was present. Striatum (Str), cortex (Cx), mesencephalon (Mc), cerebellum (Cb), hypothalamus (Hyp), hipocampus (Hc), stratum pyramidale (Py), stratum radiatum (Ra). Black arrows indicate GFP expression. Pictures in B - D were colour adjusted in Photoshop. The scale bars for B, C and D represent 0.5 mm.

