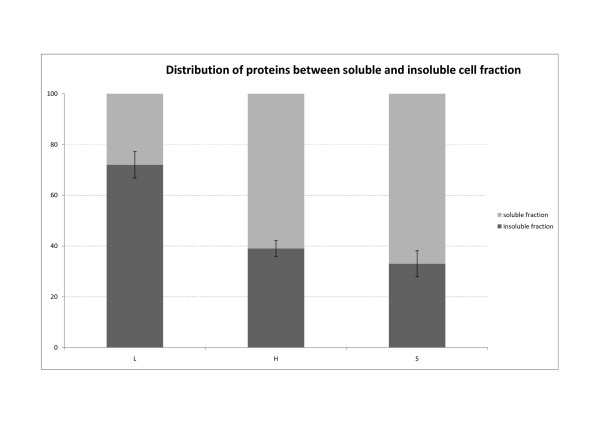
Figure 2.
Distribution of proteins between soluble and insoluble cell fraction. After cell disruption densitometric analysis of SDS-PAGE was performed and the percentage of proteins in soluble vs. insoluble fraction was determined. Three mechanisms of bacterial cell disruption were studied: enzymatic lysis (L), high pressure homogenization (H) and sonication (S). After enzymatic lysis majority of the proteins were trapped in the insoluble fraction together with almost all recombinant protein G-CSF (Figure 1). However when the cells were disrupted with mechanical forces, more proteins were released to the soluble fraction.

