
Figure 7.
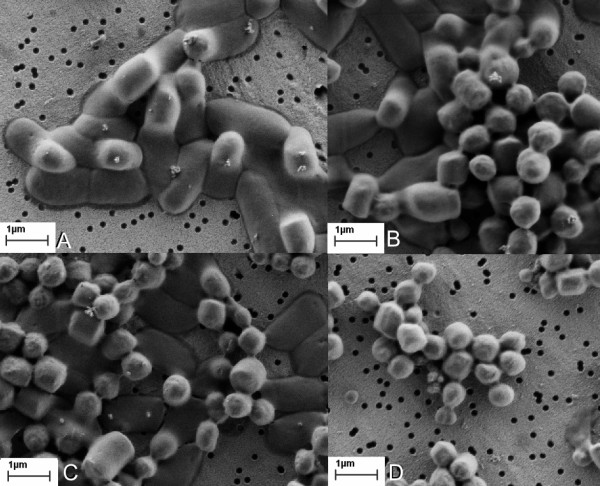
Sonication of bacterial cells in time. Whole bacterial cells producing G-CSF ncIBs before sonication. The outlines of ncIBs inside bacterial cells are visible (A). After 2 minutes of sonication the cell walls are disrupted, however ncIBs are still trapped inside the cells (B). Some ncIBs are isolated from the cells, while the others still remains trapped inside after 5 minutes of active sonication (C). All ncIBs are isolated and bacterial cell debris is removed from the sample after 8 minutes of sonication (D).