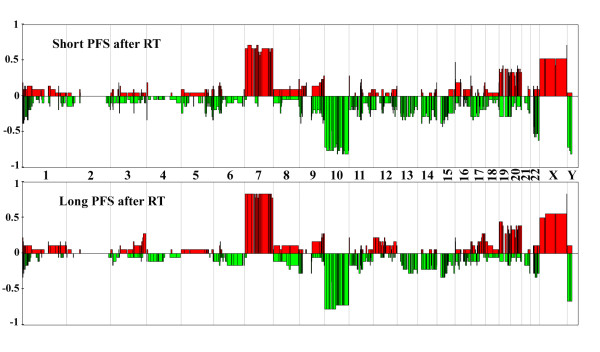
Figure 3.
Genomic profiles of patients with short and long PFS after radiation therapy. CGH array genomic profiles of the patients with short (< 5 months) and long (> 10 months) PFS after radiotherapy. For each chromosome, the telomere of the short arm is on the left and the telomere of the long arm is on the right. Genomic gains and losses are shown in red and green, respectively. The y-axis corresponds to the frequency of gains and losses in each group of patients.

