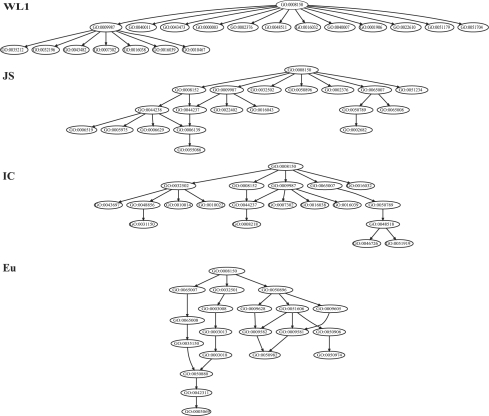
Fig. 2.
Compressed GO subgraphs. The graph of Biological Process subontology is compressed under different setting of edge distance measures, as indicated next to the graphs. A large version of the figure is shown in Supplementary Figure S1.1, and the names of GO terms are listed in Supplementary Table S2.

