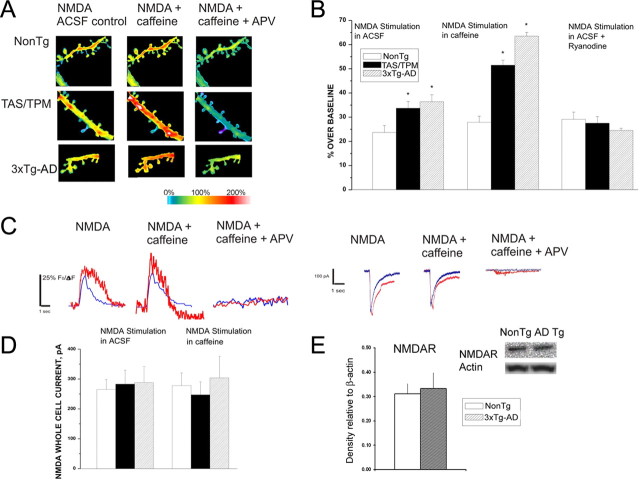
Figure 6.
NMDAR-mediated calcium influx triggers CICR in AD neurons. A, Representative pseudocolored images of maximal calcium responses evoked from NMDAR activation in NonTg (top), TAS/TPM (middle), and 3xTg-AD (bottom) neurons in control ACSF (left), 10 mm caffeine (middle), and caffeine + APV (right). B, Bar graphs showing the averaged maximal calcium response evoked from NMDAR activation for NonTg, TAS/TPM, and 3xTg-AD neurons in control ACSF (left), with concurrent RyR activation with 10 mm caffeine (middle), and NMDAR activation with ryanodine in the pipette (right). C, Left, individual representative traces of evoked calcium responses from a NonTg neuron (blue) and 3xTg-AD neuron (red) from NMDAR activation alone (left), NMDAR + 10 mm caffeine (middle), and NMDAR + caffeine + APV. Right, individual representative whole-cell current traces evoked from a NonTg neuron (blue) and 3xTg-AD neuron (red) from NMDAR activation alone (left), NMDAR + 10 mm caffeine (middle), and NMDAR + caffeine + APV. D, Bar graphs on left show averaged whole-cell currents in NonTg, TAS/TPM, and 3xTg-AD mice evoked from NMDAR activation. Bars on right (same order as on left) show averaged whole-cell currents evoked from concurrent NMDAR plus RyR activation. E, Bar graph shows no differences between steady-state NMDAR protein levels in the cortex of NonTg and 3xTg-AD mice. Inset above shows representative immunoblot images from a NonTg and 3xTg-AD sample. *Significantly different from NonTg (p < 0.05).

