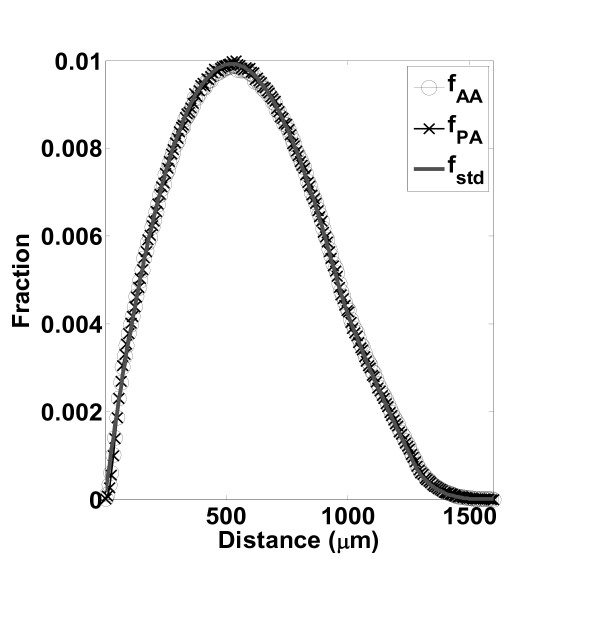
Figure 4.
Comparison of experimental and calculated distributions. Comparison of experimentally determined fAA and fPA for MC3T3-E1 on a PLGA surface and the computed standard curve, fstd. These data represent the frequency at which any cell is located a certain distance from any other cell (fAA) or from a proliferated cell (fPA) in the experiments. The standard curve was computed from a Monte Carlo simulation and represents a uniformly random probability of locating any cell a given distance from any other cell on the same sized area as our microscope images. Number of images used was 353.

