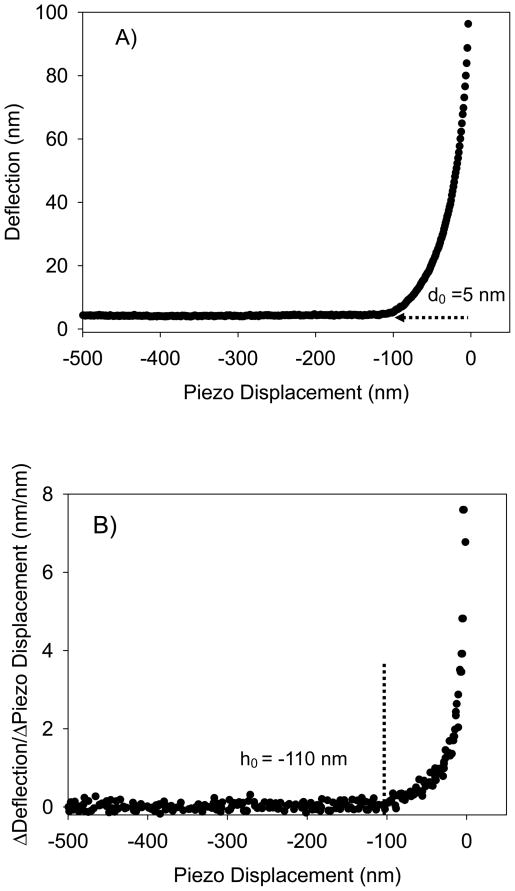
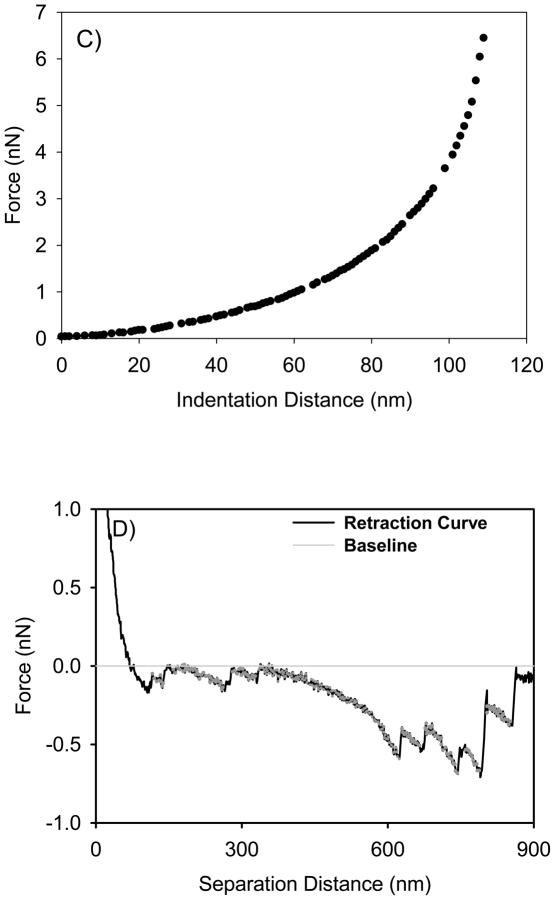
Figure 1.
A) A typical approach curve measured between the AFM tip and the bacterial surface biopolymer brush of ATCC 51776. The curve is shown as raw data in terms of the relationship between piezo displacement (h) and cantilever deflection (d). The d0 value represents the deflection offset that was subtracted from all deflection data prior to conversion of the raw deflection data to force data. B) This curve represents the change in slope of the curve in Figure 1A as a function of piezo displacement. Note that the contact point between the tip and the bacterial surface biopolymer brush was taken as the initial value at which the slope of this curve changed from zero (h0 = −110 nm). C) The force-indentation file that results from the treatments done in Figures 1A and 1B as described in the methods section. This curve is an example of curves fitted to the classic and modified Hertz models. D) A typical AFM retraction curve measured between L. monocytogenes ATCC 51776 surface biopolymers and silicon nitride. The solid gray line represents the zero force baseline. Finally, the dotted grey lines that show up on the retraction curve represent the portions of the retraction curves being stretched.


