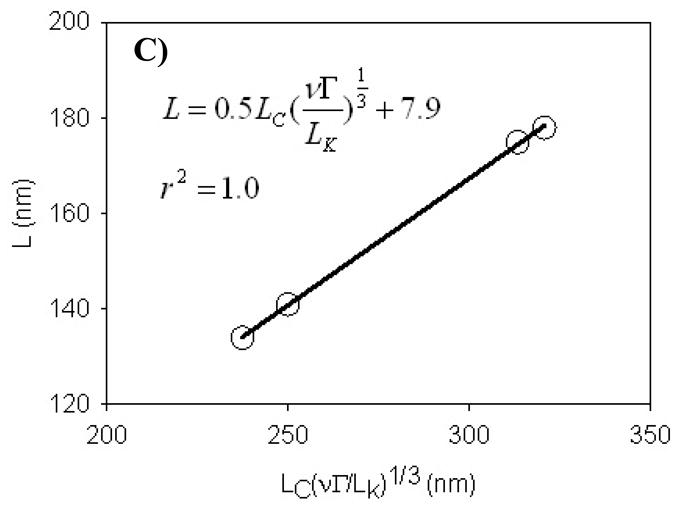
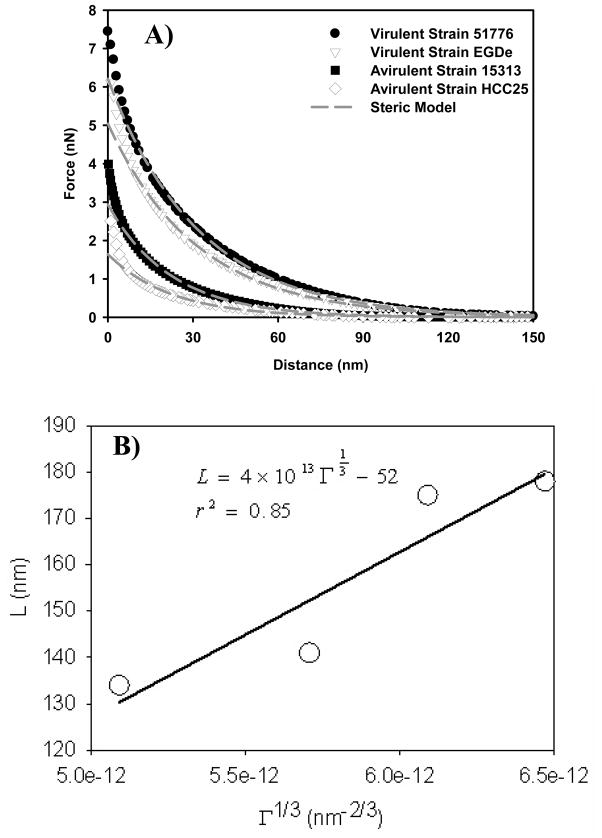
Figure 2.

A) Force-distance curves measured on virulent and avirulent strains of L. monocytogenes. Each curve is the average of 225 individual curves measured on fifteen individual cells taken from three different cultures. The solid black lines are the steric model (eq 8) fits to the force-distance data. B) The scaling relationship for uncharged grafted polyelectrolyte brush. C) The scaling relationship for charged grafted polyelectrolyte brush. Symbols in B and C are experimental values (or calculated values based on experimental data) for all four strains tested and the line is the best line fit to the data. The excluded volume (ν) values were estimated using eq 9 for all strains, values of Γ were obtained from the steric model (eq 8) fit to the approach curves data in Figure 2A collected for the four strains, Lc values were 1.25 of the brush heights, and the Kuhn length segment values (LK) were obtained from the application of the wormlike chain (WLC) model to the AFM retraction data.

