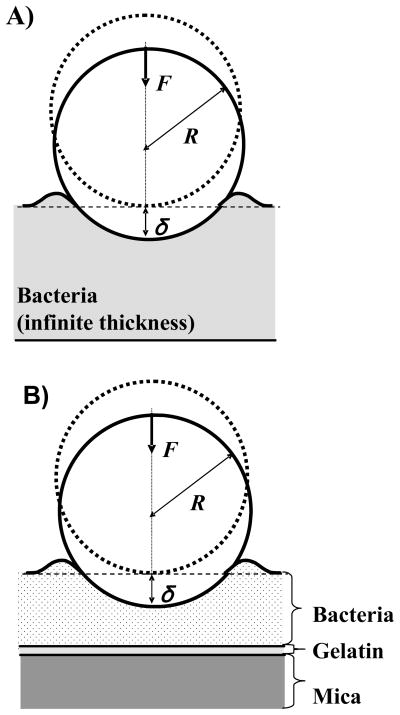
Figure 3.
Schematics of the indentation experiments using A) classic Hertz model and B) modified Hertz model. In the schematics, F is the applied indentation force, δ is the bacterial cell indentation distance resulting upon applying the indentation force, and R is the radius of the indenter (AFM tip). Note that the size of the indenter and the thickness of the bacteria and substrate are drawn not to scale for clarity purposes.

