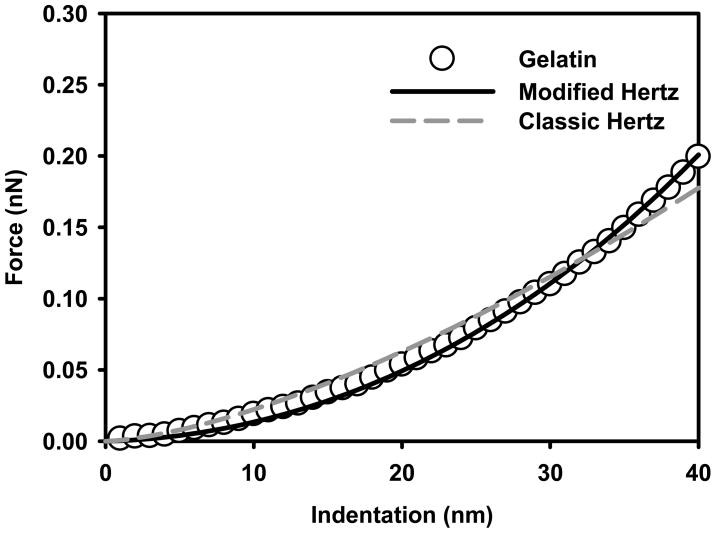
Figure 4.
Force-indentation curves measured on the thin gelatin film. Circles plotted curve represents the average of 255 individual curves measured on fifteen different spots taken from three different locations on the gelatin film. The solid and dashed lines are the classic and modified Hertz models fits to the force-indentation data.

