Figure 6.
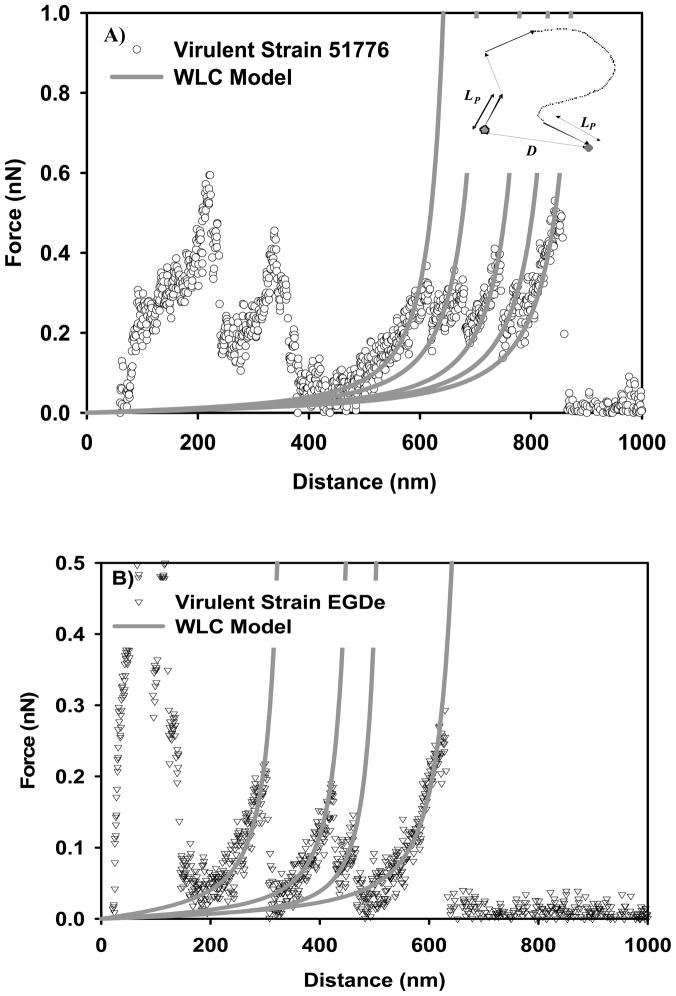
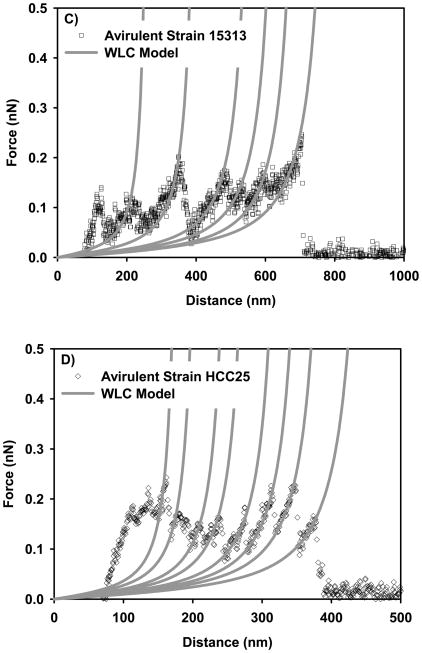
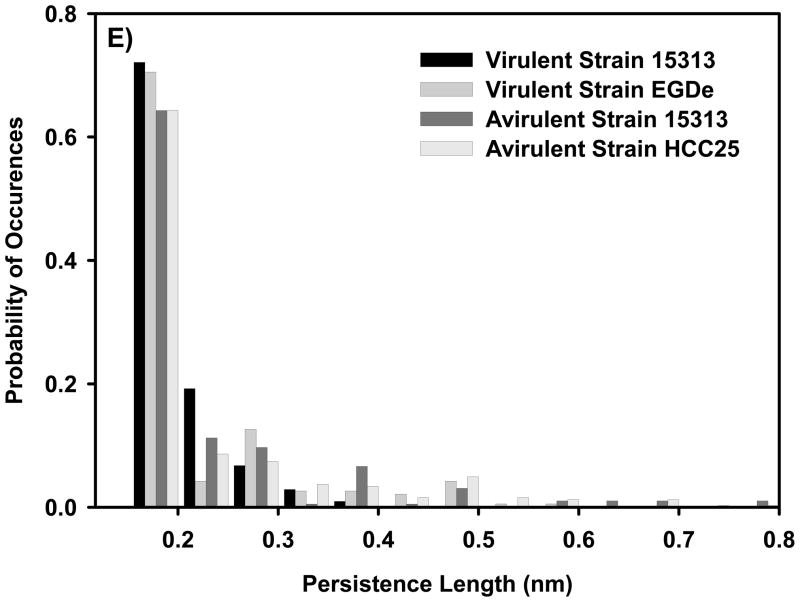
Examples on the ability of WLC model to fit the force-distance profiles representing the stretching of the bacterial surface biopolymers of: A) virulent strain 51776, B) virulent strain EGDe, C) avirulent strain 15313, and D) avirulent strain HCC25. Each solid line represents the fitting results of the WLC model to a stretching event of a bacterial surface biopolymer or a part of it and is characterized by its own values of persistence and contour lengths. Circles represent the experimental data. The inset on part A shows a schematic of a WLC chain. E) Probability histogram that shows the distribution of persistence length values estimated using WLC model for all strains investigated.


