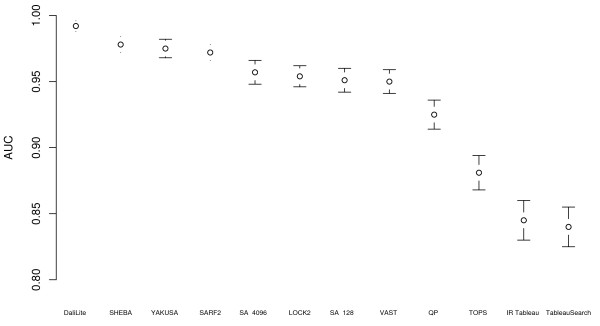
Figure 4.
AUC for different methods in the COPS benchmark data set. Area under the ROC curve (AUC) for different methods for the COPS benchmark data set. Each AUC value is shown with a 95% confidence interval. SA refers to SA Tableau Search (followed by number of restarts) and QP refers to QP Tableau Search.

