
Figure 10.
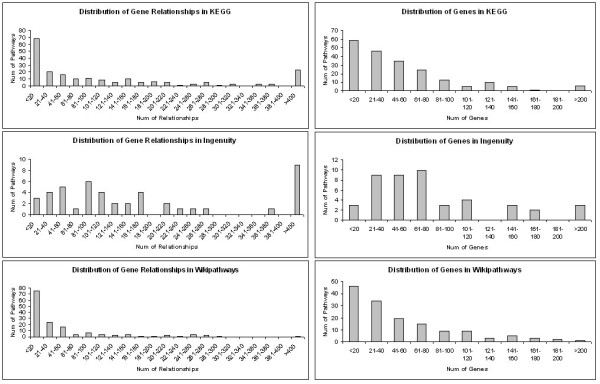
Distribution of pathway sizes in terms of genes and gene pairs. The left column shows the distribution of gene pairs within the three databases while the right column shows the distribution of genes.
Official websites use .gov
A
.gov website belongs to an official
government organization in the United States.
Secure .gov websites use HTTPS
A lock (
) or https:// means you've safely
connected to the .gov website. Share sensitive
information only on official, secure websites.
Distribution of pathway sizes in terms of genes and gene pairs. The left column shows the distribution of gene pairs within the three databases while the right column shows the distribution of genes.