
Figure 7.
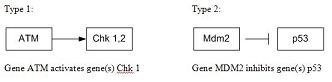
Shows two sample relationships. The inhibiting and activating gene-gene relationship. The left relationship shows an activating relationship between ATM and Chk 1,2 while the right relationship shows an inhibiting relationship between MDM2 and P53.