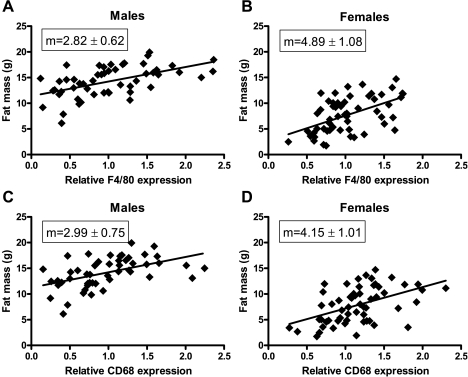
Fig. 3.
Correlation between total fat mass and macrophage markers. Relative gene expression of F4/80 (A and B) and CD68 (C and D) are plotted vs. total fat mass of individual mice after 16 wk on WD. Data from MIP-1α−/−, MIP-1α+/−, and MIP-1α+/+ mice were analyzed together. The slope (m) of each linear regression line is shown. Slopes in A and B and in C and D do not differ significantly from each other.

