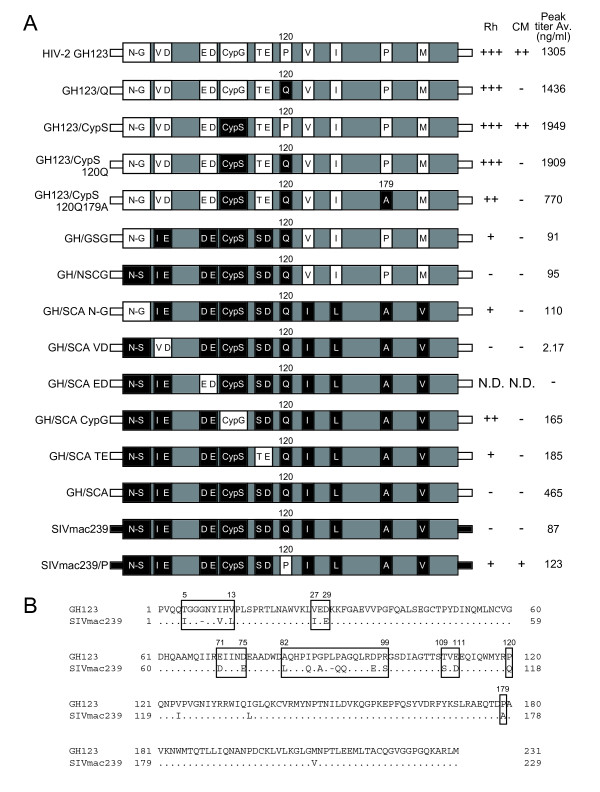
Figure 1.
Schematic representation of chimeric viral CAs. (A) White and black bars denote HIV-2 GH123 and SIVmac239 sequences, respectively. +++, ++, +, and - denote more than 1000-fold, 100- to 1000-fold, 5- to 100-fold, and less than 5-fold suppression of viral growth, respectively, compared with viral growth in the presence of negative control CM SPRY(-) TRIM5α on day 6. Peak titer Av. denotes average titers in the presence of CM SPRY(-) TRIM5α on day 6 of two independent experiments. (B) Alignments of amino acid sequences of GH123 and SIVmac239 CAs. Dots denote amino acid residues identical to one of the GH123 CA and dashes denote lack of an amino acid residue present in GH123 CA. Boxes show the regions replaced between GH123 and SIVmac239.

