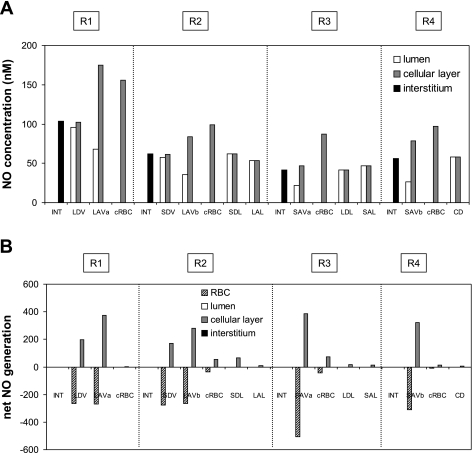
Fig. 1.
A: baseline nitric oxide (NO) concentrations (CNO) in the interstitium, vasa recta, capillaries, and tubules in each region (R1–R4), at the mid-inner stripe (IS). Results are shown for case C; CNO values in cases A, B, and C are nearly indistinguishable. Each tubule or vasa recta is assigned to the region with which it is in contact for 50% or more in the IS. The term “cellular layer” denotes the endothelium in vasa recta and capillaries, and the epithelium in tubules. CNO in red blood cells (RBC) are <1 nM and are not shown. LDV, long descending vasa recta; SDV, short descending vasa recta; LAVa and LVAb, 2 populations of long ascending vasa recta; SAVa and SAVb, 2 populations of short ascending vasa recta; LDL, long descending limb of Henle's loop; SDL, short descending limb; LAL; long ascending limb; SAL, short ascending limb; CD, collecting duct; cRBC, capillary red blood cells. B: baseline net generation (production minus consumption) rate of NO (×10−3 nmol·cm−1·s−1) in the interstitium, vasa recta, capillaries, and tubules at the mid-IS. The rates for a given type of tubule or vessel take into account the number of such tubules or vessels.

