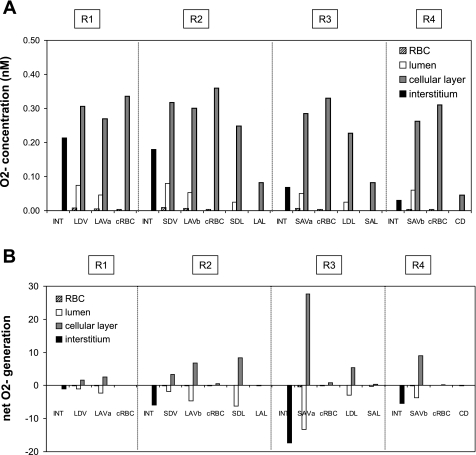
Fig. 2.
A: baseline O2− concentrations (CO2−) in the interstitium, vasa recta, capillaries, and tubules in each region, at the mid-IS. Results are shown for case C. In case B, CO2− is 33% lower everywhere. In case A, CO2− is ∼50% lower in R1, and 70–85% lower in R2–R4. B: base-case O2− net generation rates (×10−3 nmol·cm−1·s−1) in the interstitium, vasa recta, capillaries, and tubules at the mid-IS (case C).

