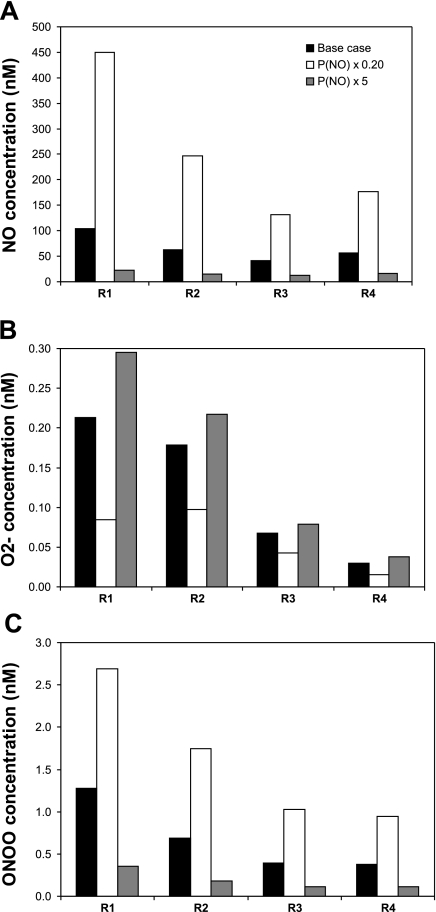
Fig. 4.
Effect of varying NO permeability (PNO) on interstitial CNO (A), CO2− (B), and CONOO (C) in each region. RBC, vascular, and tubular PNO are taken to vary together. PNO is set to its base-case value, decreased by a factor of 5, and increased by a factor of 5. Results are shown for case C. Relative concentration increases or decreases are almost identical in cases A, B, and C.

