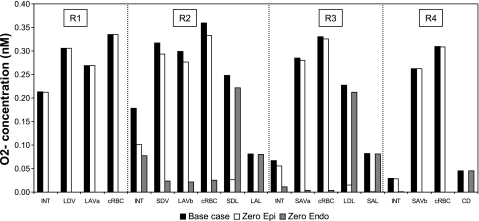
Fig. 7.
Effect of O2− synthesis inhibition on CO2− in the interstitium, vasa recta endothelium, capillary endothelium, and tubular epithelium in each region. Results are displayed for case C. Relative CO2− changes are similar in cases A, B, and C. Shown are concentrations under baseline conditions (black bars), assuming inhibition of tubular epithelial O2− synthesis only (white bars, “zero epi”), and assuming inhibition of vascular endothelial O2− synthesis only (grey bars, “zero endo”).

