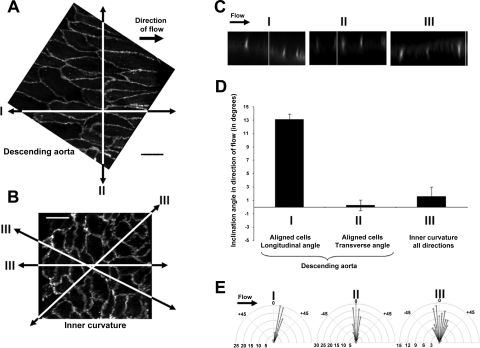
Fig. 2.
EC-cell junctions inclined uniformly in direction of flow in regions of laminar steady flow. A: en face tissue sections of the mouse aorta stained with platelet endothelial cell adhesion molecule 1 (PECAM-1) antibody show alignment of ECs with a fusiform shape in the descending aorta. B: a more disordered morphology (polygonal cells) was observed at the inner curvature of the aorta. Scale bars are 20 μm. C: XZ cross sections of the aortic endothelial layer cut longitudinally along the alignment trajectory showed an inclination of the tip of the EC-cell junction in direction of flow (sections I) as compared with transversal sections (perpendicular to flow, sections II) and arbitrary sections of the inner curvature (sections III). D: bar graph depicts EC-cell junction inclination angle mean values for each group. E: polar plots illustrate the distribution of the frequency of the inclination angles (by increment of 5° angles) for each group.

