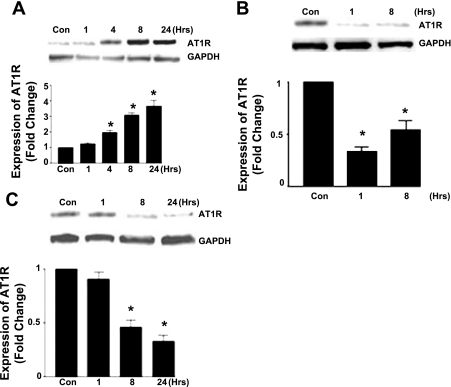
Fig. 3.
Effect of p65 inhibition on ANG II type 1 receptor (AT1R) expression. A–C: Western blot of CATH.a cell lysates showing protein expression following stimulation with ANG II (100 nM) over the specified time course (A), following p65 gene silencing using siRNA (B), and following treatment with parthenolide (10 μM) (C). (n = 5, *P < 0.05.)

