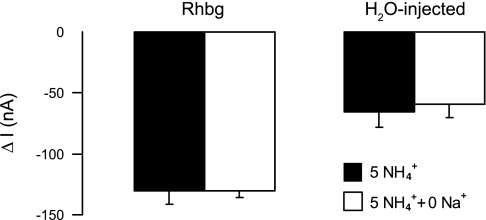
Fig. 14.
Summary graph comparing the effects of Na+ on NH3/NH4+-induced current. In Rhbg oocytes, NH3/NH4+-induced current was −130 ± 11 nA (n = 5) in the presence of Na+ and −130 ± 6 nA in the absence of Na+ (P > 0.05). In H2O-injected oocytes, NH3/NH4+-induced current was −65 ± 13 nA (n = 5) in the presence of Na+ and −60 ± 11 nA in its absence (P > 0.05).

