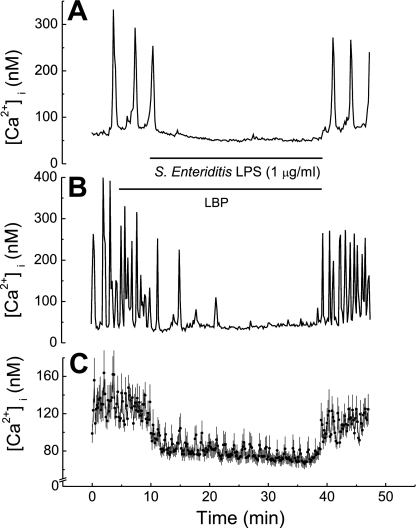
Fig. 4.
Effect of LPS derived from Salmonella enteritidis on basal [Ca2+]i and [Ca2+]i oscillations in HL-1 cells. A: [Ca2+]i versus time in a single HL-1 cell. Trace shows both inhibition of [Ca2+]i oscillations plus reduction in basal [Ca2+]i. B: [Ca2+]i versus time in a single HL-1 cell. Trace shows only inhibition of [Ca2+]i oscillations. C: [Ca2+]i versus time. Values are means ± SE (n = 16 cells). Horizontal bars show application time of LBP (10 ng/ml) and of LPS for all traces.

