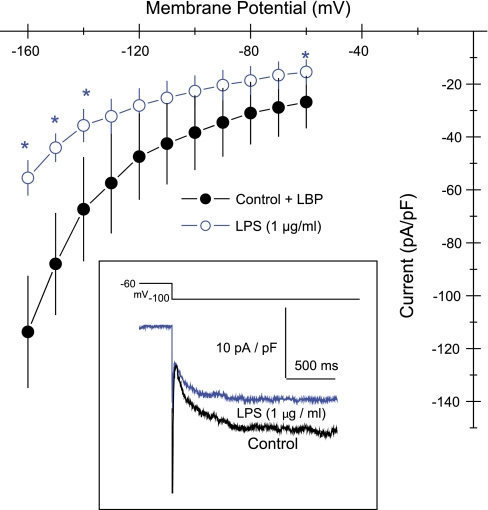
Fig. 8.
Current-voltage plots of hyperpolarization-activated inward current, If, in HL-1 cells. ●, Control cells; ○, cells treated with E. coli LPS. Values are means ± SE (n = 6). *Significantly different from control (P < 0.05). Inset: representative traces from the same cell before (black) and after (blue) added LPS. Holding potential (HP) = −60 mV.

