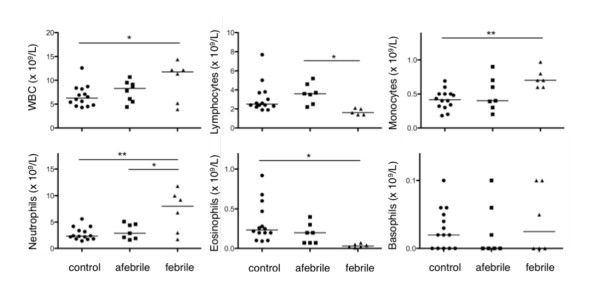
Figure 2.
Scatter plot of white blood cells. The abundance (x 109/L) of white blood cells (WBC; top left), lymphocytes (top centre), monocytes (top right), neutrophils (bottom left), eosinophils (bottom centre) and basophils (bottom right). Absolute cell numbers are reported in Additional File 3, Table S2.

