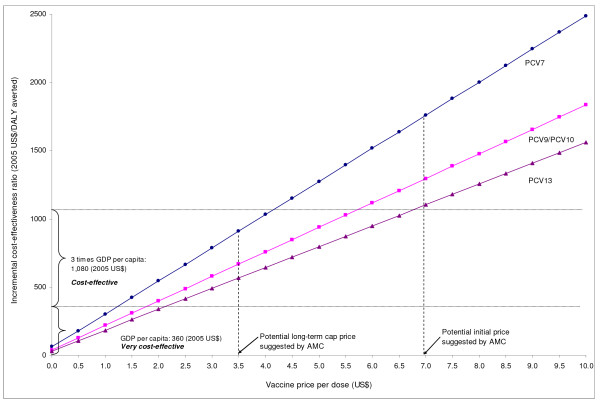
Figure 4.
Deterministic sensitivity analysis: Cost-effectiveness of pneumococcal conjugate vaccines (PCVs) by vaccine price. This graph shows how cost-effectiveness of each type of PCVs varies as the unit price of vaccines are varied up to $10. The lower horizontal line indicates the threshold cost-effectiveness ratio based on Gambia's GDP per capita. The upper horizontal line indicates three times GDP per capita.

