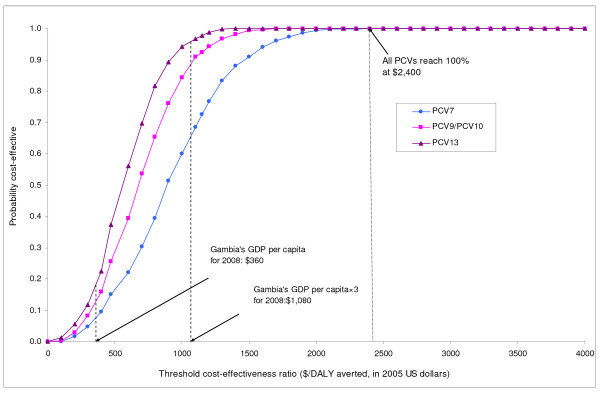
Figure 5.
Probabilistic sensitivity analysis: Cost-effectiveness acceptability curves. This graph summarizes the results of a probabilistic sensitivity analysis from the societal perspective. The curve shows, for each type of PCVs, the probabilities that pneumococcal vaccination would be cost-effective at varying cost-effectiveness threshold ratios. For example, the probabilities that PCV7 would be cost-effective are 8% and 66% at cost-effectiveness thresholds of $360 (corresponding to The Gambia's GDP per capita) and $1,080 (corresponding to three times The Gambia's GDP per capita) per DALY averted, respectively. All PCVs would be considered 100% cost-effective with the threshold set at $2,400 per DALY averted.

