
Fig. 4.
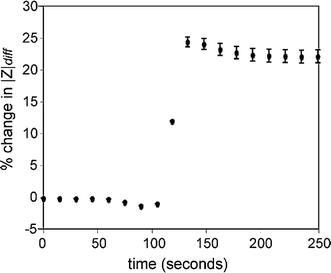
Percent change in the magnitude of the impedance (f = 300 kHz) when cells are captured. Error bars represent one standard deviation for seven cells
Official websites use .gov
A
.gov website belongs to an official
government organization in the United States.
Secure .gov websites use HTTPS
A lock (
) or https:// means you've safely
connected to the .gov website. Share sensitive
information only on official, secure websites.
Percent change in the magnitude of the impedance (f = 300 kHz) when cells are captured. Error bars represent one standard deviation for seven cells