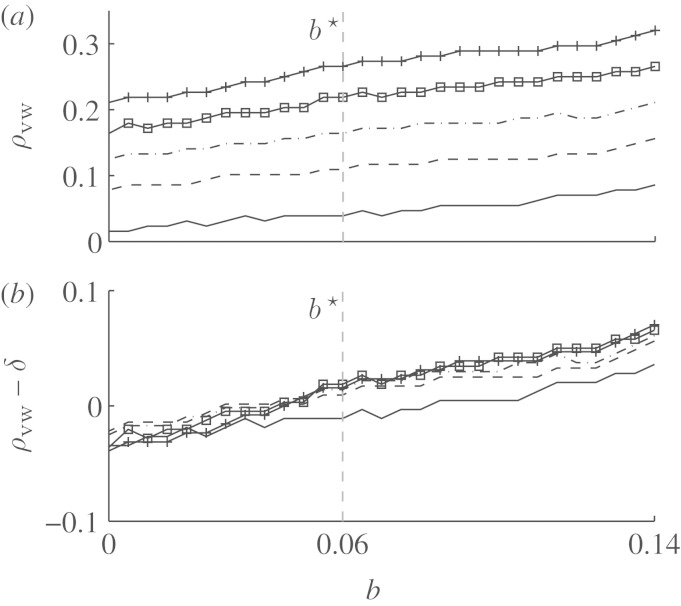
Figure 10.
Vulnerable window width for a=0.8 (numerical step Δb=0.005). (a) For the values of b inside the region S (compare to figure 5), the normalized vulnerable window width ρvw is plotted for five different stimulus widths δ. (b) The same data as in (a). Here, ρvw−δ is plotted instead of ρvw. The results for different δ are very similar, with increased deviation only for the smallest value δ=0.05. The almost identical curves in (b) can be explained by the linear dependence of the ρvw found analytically by Starmer et al. (1993). Plus symbols on a solid line, δ=0.25; empty squares on a solid line, δ=0.2; dot-dashed line, δ=0.15; dashed line, δ=0.1; solid line, δ=0.05.

