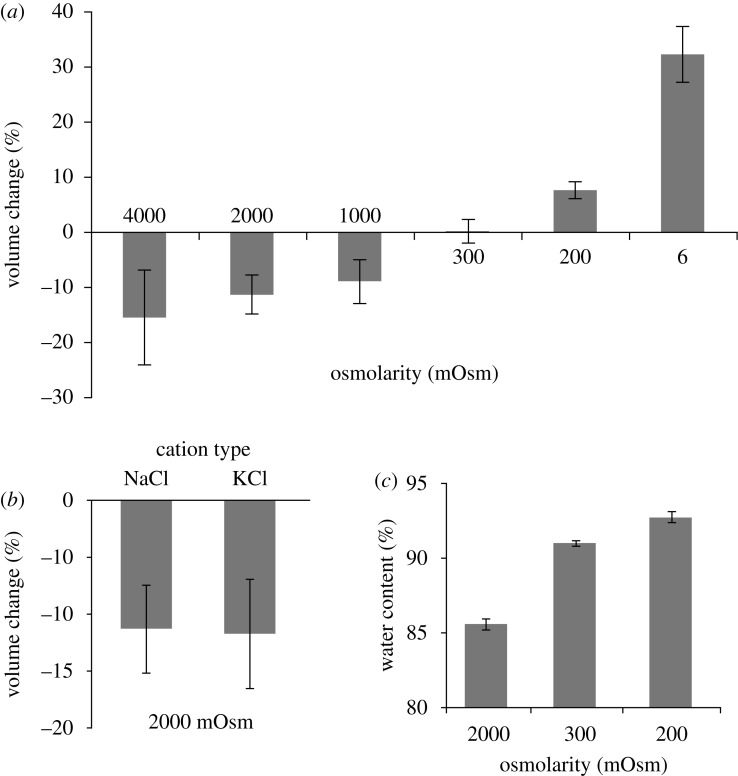
Figure 3.
(a–b) Change in volume and (c) water content of dead slices of tissue after 3 h exposure to bathing solutions of different ionic osmolarity. Hypertonic groups all shrank significantly (p<0.05) and hypotonic groups all swelled significantly (p<0.05; (a)). The shrinking effects of adding NaCl or KCl were not significantly different (p=0.94; (b)). All changes in water content were significantly different (p< 0.01) and correlated to changes in volume (R2=0.97; (c)). All data presented as mean ± s.e.m.

