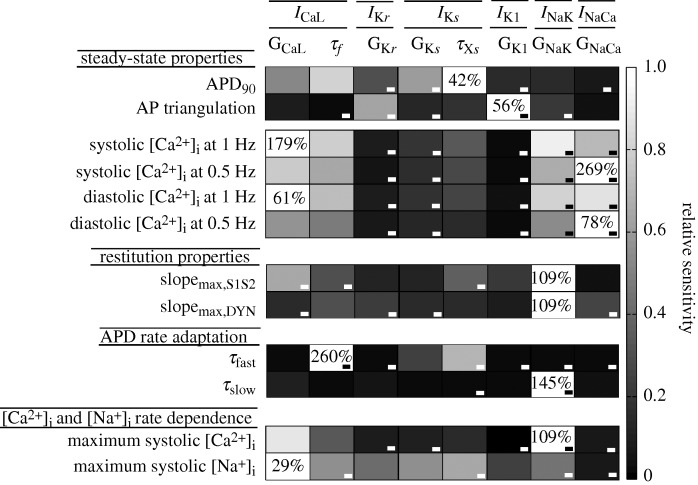
Figure 2.
Impact of ionic current variability on cellular electrophysiological biomarkers of arrhythmic risk. Electrophysiological properties are shown in the first column and ionic current properties appear in the first row. Relative sensitivities are depicted in grey code, with white being the colour that indicates the maximum sensitivity of an electrophysiological property. ICaL, L-type calcium current; IKr, the rapid component of the delayed rectifier current; IKs, the slow component of the delayed rectifier current; IK1, inward rectifier potassium current; INaK, sodium–potassium pump current; INaCa, sodium–calcium exchanger current; GCaL, maximal conductance of ICaL; τf, slow voltage-dependent inactivation gate time constants of ICaL; GKr, maximal conductance of IKr; GKs, maximal conductance of IKs; τXs, activation time constant of IKs; GK1, maximal conductance of IK1; GNaK, maximal activity of the sodium–potassium pump; GNaCa, maximal activity of the sodium–calcium exchanger.

