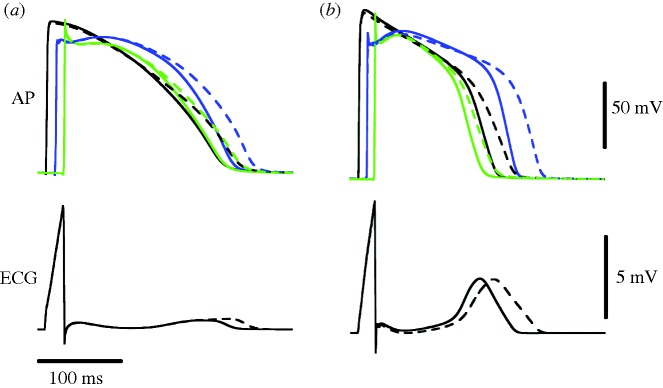
Figure 3.

Action potentials (AP) from a representative node of each transmural layer and also the pseudo-ECG for the control (solid lines) and 100% IKr blockade (dashed lines) conditions, for the rabbit (a) and the guinea pig (b) models (black line, endocardium; blue line, M cell; green line, epicardium).
