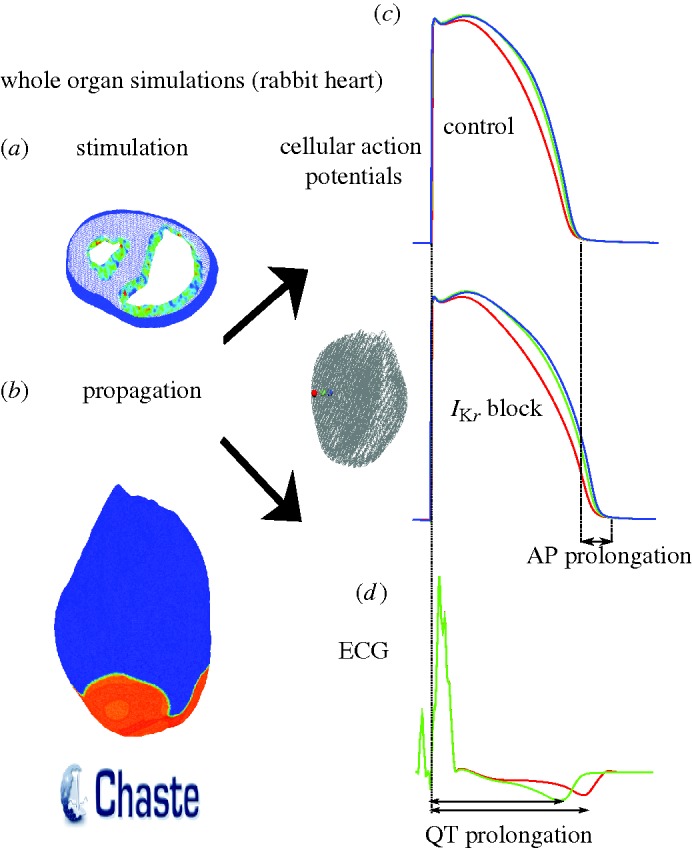
Figure 6.

(a) Endocardial activation seen in a sliced whole heart. (b) Snapshot of AP propagation across the epicardial surface. (c) Representative AP traces in control and IKr block conditions at nodes located in the epicardial (red line), mid-myocardial (green line) and endocardial (blue line) layers. (d) Pseudo-ECG computed at a distance of approximately 3 cm from the epicardium (IKr block, red line; control, green line).
