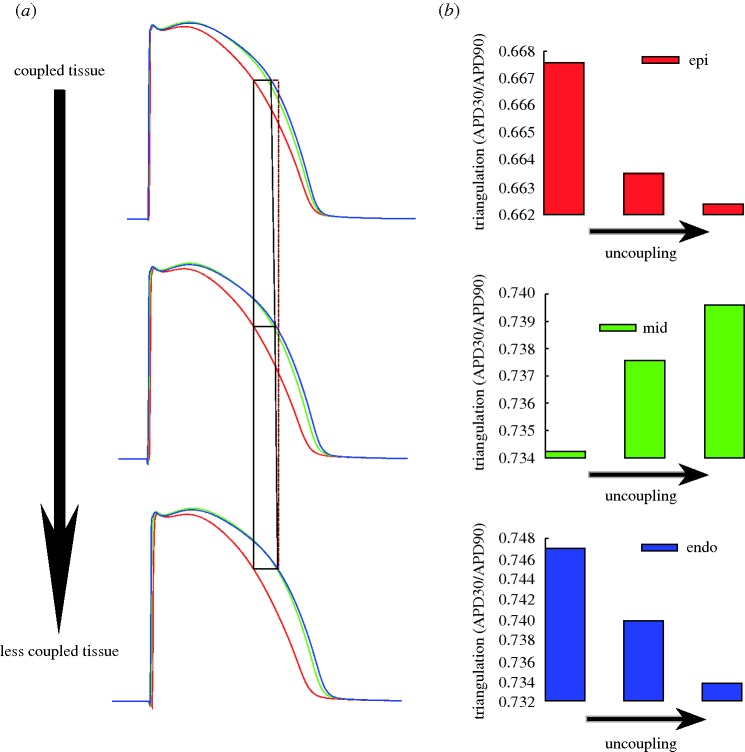
Figure 7.
(a) Action potentials recorded at representative nodes in the mesh under different coupling conditions (β=0.428 μs in the top panel, β= 0.214 μs in the middle panel and β=0.14 μs in the bottom panel; endocardial, blue line; mid-myocardial, green line; and epicardial, red line). The differences between epicardial and endocardial APs are highlighted (red line is a straight line). (b) Effect of coupling on APD triangulation for epicardial, mid-myocardial and endocardial nodes.

