Figure 3.
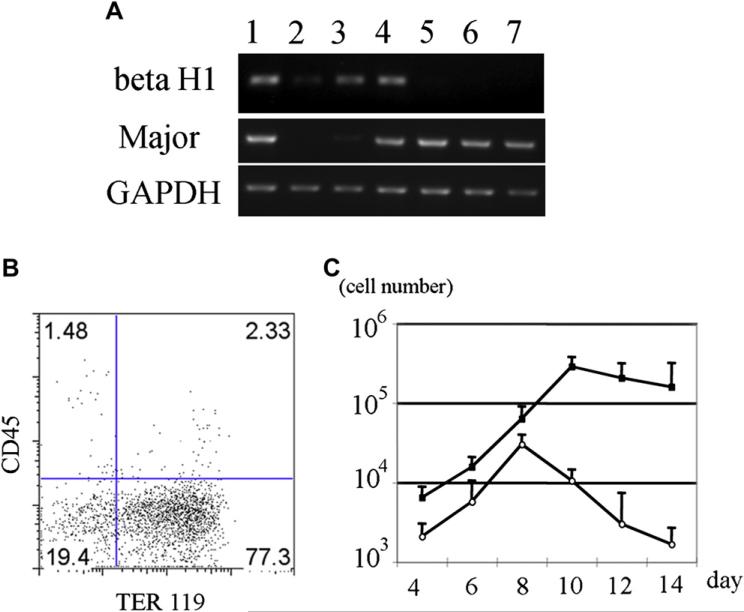
Erythropoiesis from mGS Flk1+ cells shows two different waves. Flk1+ cells were cultured on OP9 with erythropoietin (EPO) and with or without ACK45. The nonadherent cells in the culture were collected every other day, counted the number (C), examined the surface markers (B) and hemoglobin gene expression (A). Sequential RT-PCR analysis shows expression of β H1 hemoglobin mRNA, followed by b-major hemoglobin mRNA expression (A). E12.5 fetal liver (lane 1), E8.0 embryo (lane 2), mGS- Flk1+ cells on OP9 for 4 days (lane 3), for 6 days (lane 4), for 8 days (lane 5), for 10 days (lane 6), for 12 days (lane 7). Flk1+ cells were cultured on OP9 cells with EPO and with (white circle) or without ACK45 (black square) (C). Most cells in the culture were Ter119+ erythrocyte (B). Definitive erythropoiesis was blocked by ACK45 (C). GAPDH = glyceraldehydes phosphate dehydrogenase.

