
Figure 3. ECs circumscribing the central space of VEGF treated allantoic spheroid exhibit properties of an endothelium.
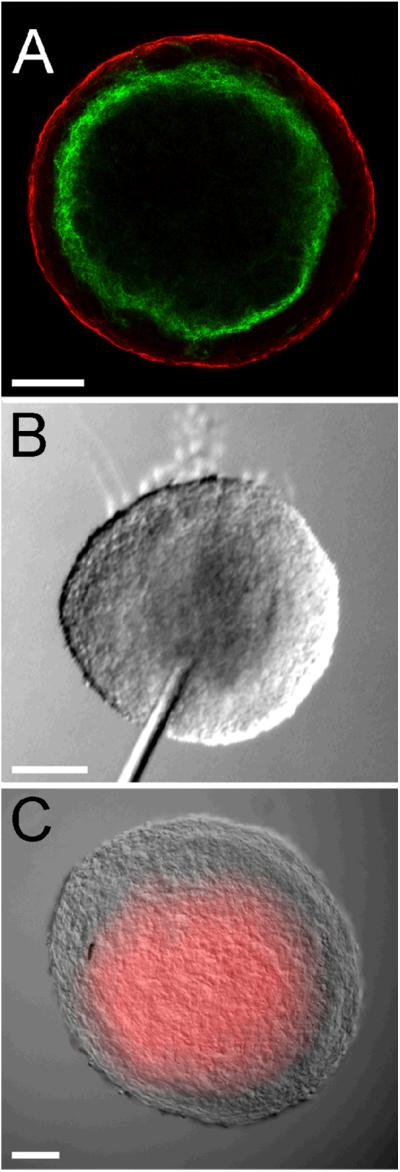
A, LSCM optical section (3 μm) of a VEGF treated spheroid immunolabeled with antibodies to VE-cadherin (green) and SMαA (red). The data presented in A is representative of microscopic analysis of 4 spheroids. B and C, DIC images of a VEGF treated spheroid prior to (B) and following (C) injection of fluorescently conjugated Qdots into the central cavity. The increment of time between the image shown (B) and (C) is <1 second. Bars equal 100 μm. The data presented in B and C is representative of microscopic analysis of 6 spheroids.