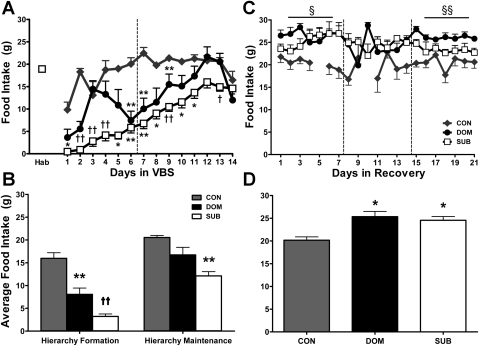
Fig. 3.
Food intake. Hab indicates the average consumption during the 7-day habituation period prior to VBS exposure. The vertical line separates the hierarchy-formation and hierarchy-maintenance phase of VBS housing and the 3 wk of the recovery period (see materials and methods). The horizontal lines above the weeks of recovery indicate a significant difference was found across that week, and the symbol indicates which groups were different and is defined in each figure legend. These time points and line indicators will be represented on each of the following meal pattern graphs [Hab: n = 12; VBS: n = 6 (CON), n = 7 (DOM), n = 21 (SUB); Recovery: n = 6 (CON), n = 6 (DOM), n = 18 (SUB)] A and B: CON food consumption is comparable to Hab. DOM and SUB are hypophagic during the initial VBS housing period; however, SUB food intake remains suppressed throughout the hierarchy-maintenance phase, where DOM express CON levels of energy consumption. C and D: CON consumed values comparable to habituation and hierarchy-maintenance values throughout recovery. DOM and SUB were hyperphagic during recovery compared with CON and to both the habituation and hierarchy-maintenance phase. Data are expressed as means ± SE. *P < 0.01 vs. CON; **P < 0.001 vs. CON; †P < 0.01 vs. CON and DOM; ††P < 0.001 vs. CON and DOM; §P < 0.05 CON vs. SUB and DOM; §§P < 0.001 CON vs. SUB and DOM.

