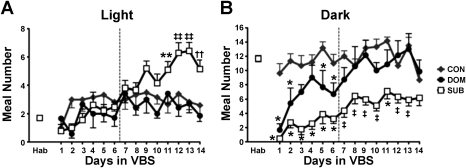
Fig. 6.
Light vs. dark analysis: meal frequency. A: SUB consumed significantly more meals during the light phase once the VBS hierarchy was stable. B: during VBS housing DOM initially took fewer meals during the dark but recovered to CON levels. SUB had a decreased meal frequency in the dark throughout VBS housing. Data are expressed as means ± SE. *P < 0.01 vs. CON; **P < 0.001 vs. CON; ††P < 0.001 vs. DOM; ‡P < 0.01 vs. CON and DOM; ‡‡P < 0.001 vs. CON and DOM.

