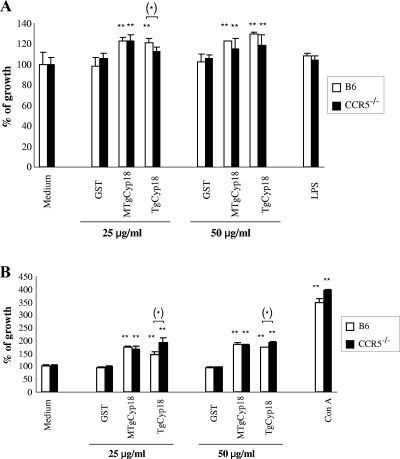
FIG. 2.
TgCyp18-induced macrophage and spleen cell proliferation. (A) Macrophages (5 × 10⁵) from B6 and CCR5−/− mice were cultured for 24 h with 25 or 50 μg/ml of TgCyp18, MTgCyp18, or GST or 10 ng/ml LPS. (B) Spleen cells (5 × 10⁵) from B6 and CCR5−/− mice were cultured for 48 h with 25 or 50 μg/ml of TgCyp18, MTgCyp18, or GST or 5 μg/ml ConA. Then, 10 μl of Cell Counting kit 8 reagent was added. After 3 h of incubation at 37°C, the optical density was determined at 450 nm. The percentage of growth was calculated by dividing each value (control or tested) by the average mean of the control samples (nontreated cells, complete medium) multiplied by 100. Each value represents the mean ± the standard deviation of triplicate samples. The results are representative of three repeated experiments with similar results. Statistical significance was calculated compared to the control groups (complete medium or GST) with an ANOVA and follow-up test (LSD). **, high significance (P < 0.01). In addition, the statistical difference between the wild-type B6 and CCR5−/− cells upon stimulation with the same dose of TgCyp18 was calculated using an independent Student t test. *, significance at P < 0.05.

