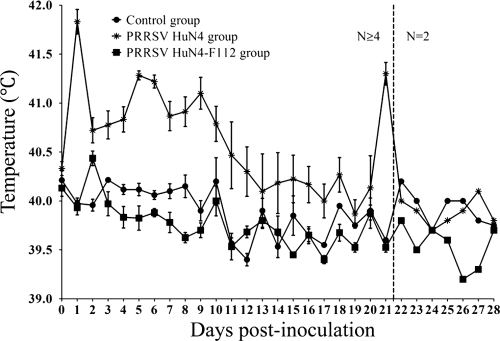
FIG. 1.
Body temperature changes in pigs before and after infection. Shown are daily average temperatures of animals in group 1 infected with PRRSV strain HuN4, group 2 pigs infected with PRRSV HuN4-F112, and group 3 control pigs. Each point represents the mean (±standard deviation [SD]) generated from all pigs at 0 to 21 days p.i. or the mean generated from 2 pigs at 22 to 28 days p.i.

