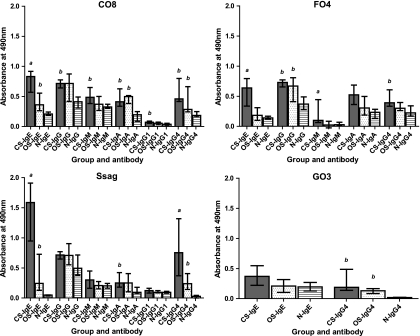
FIG. 3.
Specific anti-CO8, -FO4, -GO3, and -Ssag1.2 plasma antibody levels measured by ELISA in subjects with CS and OS and naïve (N) subjects. The bars represent the median with interquartile range. a, significantly different (P < 0.05) from OS and N groups; b, significantly different (P < 0.05) from the N group only. Specific P values are given in the text.

