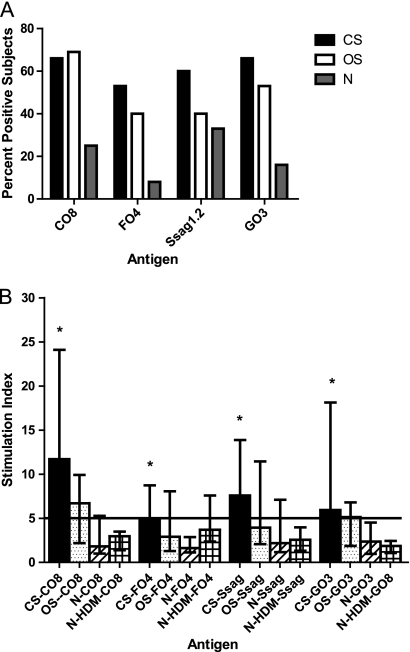
FIG. 5.
(A) Percentage of subjects showing positive responses (stimulation index ≥ 5) after culture of PBMCs stimulated with S. scabiei recombinant proteins CO8, FO4, Ssag1.2, and GO3. All CS and OS group results were significantly different (P < 0.05) from those of the N group. (B) Mean SI (with 95% confidence interval) after culture of PBMC stimulated with S. scabiei recombinant proteins CO8, FO4, Ssag1.2, and GO3. *, significantly different (P < 0.05) from the N group for each protein. Specific P values are given in the text. CS, n = 15; OS, n = 12; N, n = 12; N-HDM, n = 5.

