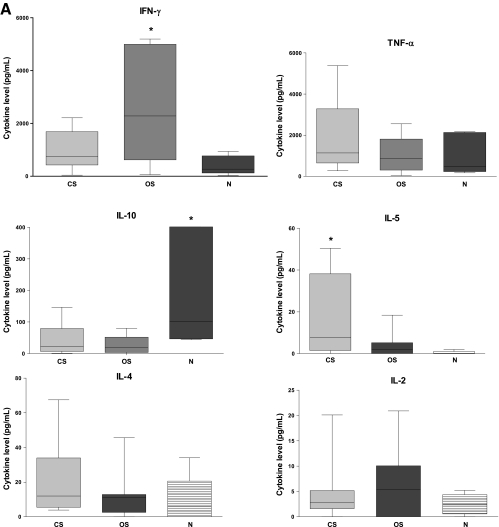
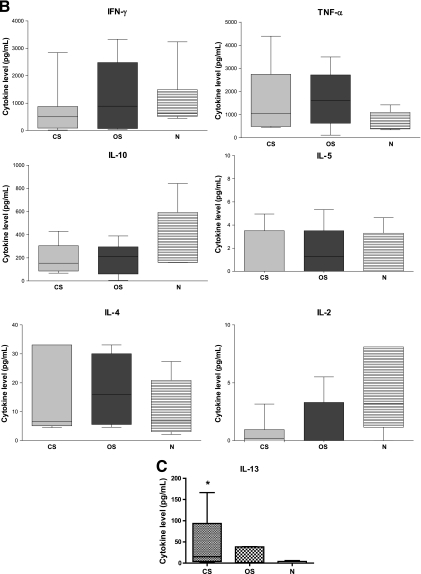
FIG. 6.
(A) Secreted IFN-γ, TNF, IL-10, IL-5, IL-4, and IL-2 cytokine levels analyzed at 72 h from CO8-stimulated PBMCs. CS, n = 7; OS, n = 7; N, n = 5. Note that one N value (IL-10) is outside the graph limits (797 pg/ml). (B) Secreted IFN-γ, TNF, IL-10, IL-5, IL-4, and IL-2 cytokine levels analyzed at 72 h from Ssag1.2-stimulated PBMCs. CS, n = 6; OS, n = 7; N, n = 5. (C) Secreted IL-13 cytokine levels analyzed at 48 h from CO8-stimulated PBMCs. CS, n = 5; OS, n = 5; N, n = 5. The bars represent box and whiskers displaying minima and maxima. *, significantly different (P < 0.05) from the N group. Specific P values are given in the text. Horizontal lines within the bars indicate medians.


