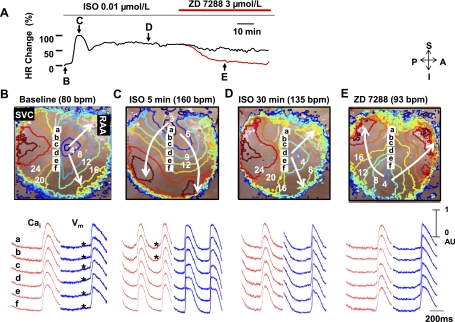
Fig. 3.
Effect of a prolonged low-dose Iso infusion (n = 8). A: HR trends after a prolonged (>1 h) isoproterenol infusion of 0.01 μmol/l. HR was increased to a maximum at 5 min, decreased after 10 min, and maintained for 140 min (black line, n = 3). ZD infusion (3 μmol/l) decrease HR close to the baseline level (red line, n = 8). B–E: Vm isochronal maps of the SAN and surrounding RA (top) and intracellular Ca2+ (Cai2+; red) and Vm (blue) tracings from the superior (sites a and b), middle (sites c and d), and lower (sites e and f) SAN. B: baseline. Note the diastolic depolarization (*) in the SAN. C: Iso infusion for 5 min. Note the late diastolic Cai2+ elevation (LDCAE; *) from the superior SAN. D: Iso infusion for 1 h. Note the disappearance of LDCAE with shifting of the leading pacemaker site to the inferior SAN (site e). E: ZD infusion for 30 min. The pacemaker site shifted to the more inferior SAN (site f). Numbers on the Vm isochronal maps are in milliseconds. AU, arbitrary units.

