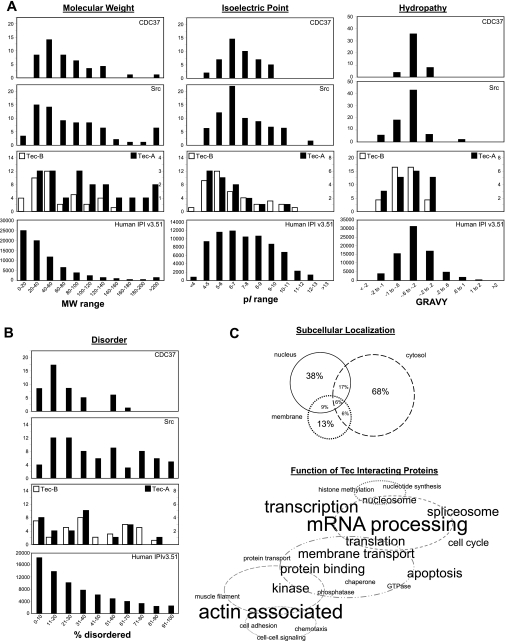
Fig. 6.
Subsets of interactors within the Tec signaling network. MS data were acquired on proteins associating with Tec (Fig. 5) and, after an analysis with distinct protein identification criteria, revealed two subsets of Tec interactors. Subset A was defined as interactors with 1) identification by ≥5 peptides in ≥2 purification runs and 2) never being identified (with 5 peptides) in a control run. Subset B was defined as interactors with 1) identification by ≥2 peptides in ≥2 purification runs and 2) never being identified (with 2 peptides) in a control run. A: physicochemical analysis of each tier of Tec interactor compared with the entire tandem MS-detectable proteome (as calculated from human IPI database version 3.51). Two other published experimental subproteomes with relevance to Tec signaling, Src (2) and CDC37 (20), are shown for comparison. MW, molecular weight; pI, isoelectric point; GRAVY, grand average of hydropathy. B: percentages of disordered regions in individual proteins from the various proteomes in our study as predicted by the DISOPRED2 algorithm. C: based on the UniProt annotations of subset A and B proteins, subcellular localization and protein function were visually represented. In the Venn diagram, percentages correspond to the portion of interactors with annotated localization in the three cellular compartments enriched in this data set. In the word cloud, proteins are grouped with relevance to cellular processes, and the font size corresponds directly to the number of proteins with the given annotation.

